
Excerpts from the Executive Summary:
The adoption of video conferencing products and services is not uniform throughout the world. As discussed in several Brockmann & Company reports studying the service in various industries, MidMarket and by desktop and room-based reports, video conferencing is on a growth curve. It promises to break through the niche barriers in the coming years.
This report defines the perspective of our global business user panel and presents regional variances for discussions. In some parts of the world, for cultural, historical, telecom regulatory and economic reasons there is tremendous diversity in adoption, practice and potential. Clearly, regions do matter.
Recommendations for users including comparing your own experience with that of the regional peers, measure reliability of their implementation so as to compare with prospective competitive solutions and to consider the concierge service of the telepresence managed service provider.
List of figures and tables:
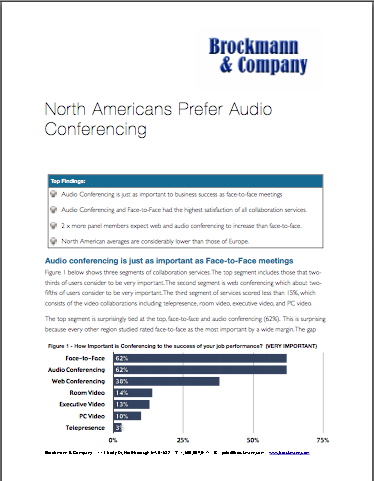
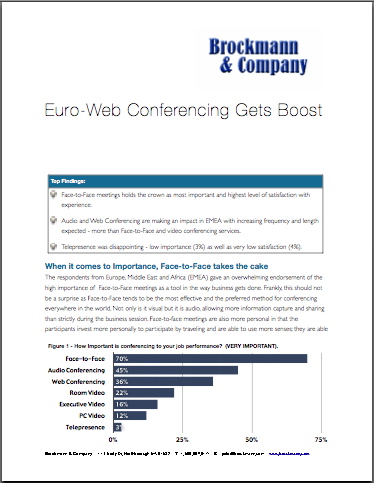
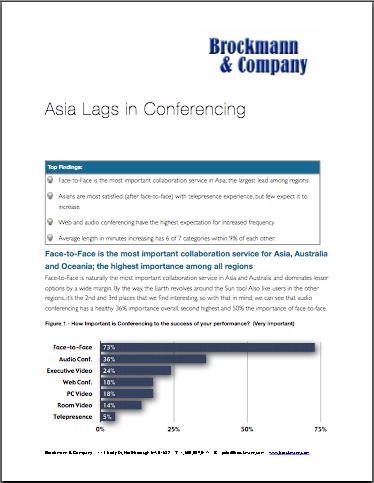
- Figure 1 – Percent of respondents reporting that conferencing is very important to their business success by region.
- Figure 2 – Percent of respondents reporting that desktop video conferencing is very important to their job performance, by region.
- Table 3 – Desktop video conferencing consumption by region.
- Figure 4 – Percent of respondents reporting that room video conferencing is very important to job performance.
- Table 5 – Room-based video conferencing consumption by region.
- Figure 6 – Average value in US$, of attending a video conferencing session instead of traveling 40 miles or 60 km to attend a face-to-face meeting.
- Table 7 – Comparing 40-mile, 60-km business trip with video conferencing.
- Table 8 – Percent of users recommending the ‘one thing’ to improve the conferencing experience at their organization.
- Figure 9 – Percent of respondents rating the highest quality experience as high definition or telepresence, by region.
- Figure 10 – Percent of users rating factor as very important in decisions about video conferencing equipment.
- Figure 11 – Relative proportion of research participants by region.
- Table 12 – Job classes of respondents.