
Can You Earn This Kind of Return for Yourself?
YES! You Can.
Be aware that 7/8 active fund managers can’t beat the Index. But you can. We can show you how.
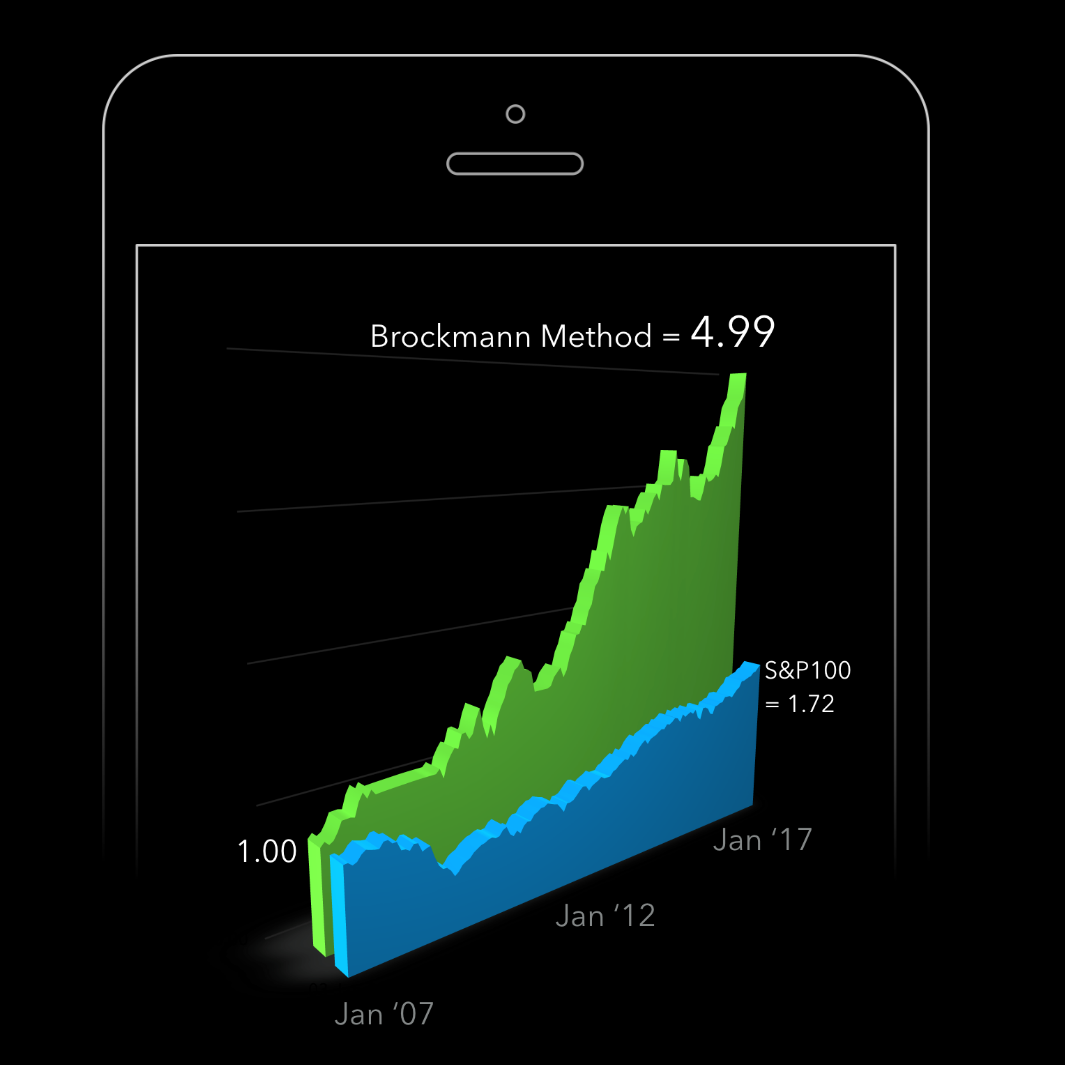
Consider the picture on the right. Clearly, we want to be the owner of the green curve, not the blue curve. Here’s what that means:
- If an investor had invested in a S&P 100 Index-tracking fund, such as OEF, their money would have grown to $1.76 for every $1 invested in January 2007. That’s the blue curve.
- As a comparison, if the investor had applied the ‘Brockmann Method’ over the past ten years, their $1 investment would have grown to $6.65 by April 2018. That’s 3.8 times better than the Index!
We’ve imbedded the Brockmann Method into the Beyond ETFs app so subscribers can learn the details of the two most important pieces of investment information they need to be effective: When to SELL* and what to BUY*.
This post has already been read 0 times!
Edit